library(tidyverse)
library(tidymodels)
library(knitr)

heart_disease <- read_csv(here::here("ae", "data/framingham.csv")) %>%
  select(totChol, TenYearCHD) %>%
  drop_na() %>%
  mutate(high_risk = as.factor(TenYearCHD)) %>%
select(totChol, high_risk)AE 9: Odds
Important
Go to the course GitHub organization and locate the repo titled ae-9-odds-YOUR_GITHUB_USERNAME to get started.
Packages
Linear regression vs. logistic regression
State whether a linear regression model or logistic regression model is more appropriate for each scenario:
Use age and education to predict if a randomly selected person will vote in the next election.
Use budget and run time (in minutes) to predict a movie’s total revenue.
Use age and sex to calculate the probability a randomly selected adult will visit Duke Health in the next year.
Heart disease
Data: Framingham study
This data set is from an ongoing cardiovascular study on residents of the town of Framingham, Massachusetts. We want to use the total cholesterol to predict if a randomly selected adult is high risk for heart disease in the next 10 years.
high_risk:- 1: High risk of having heart disease in next 10 years
- 0: Not high risk of having heart disease in next 10 years
totChol: total cholesterol (mg/dL)
Outcome: high_risk
ggplot(data = heart_disease, aes(x = high_risk)) +
  geom_bar() +
  scale_x_discrete(labels = c("1" = "High risk", "0" = "Low risk")) +
  labs(
    title = "Distribution of 10-year risk of heart disease",
    x = NULL)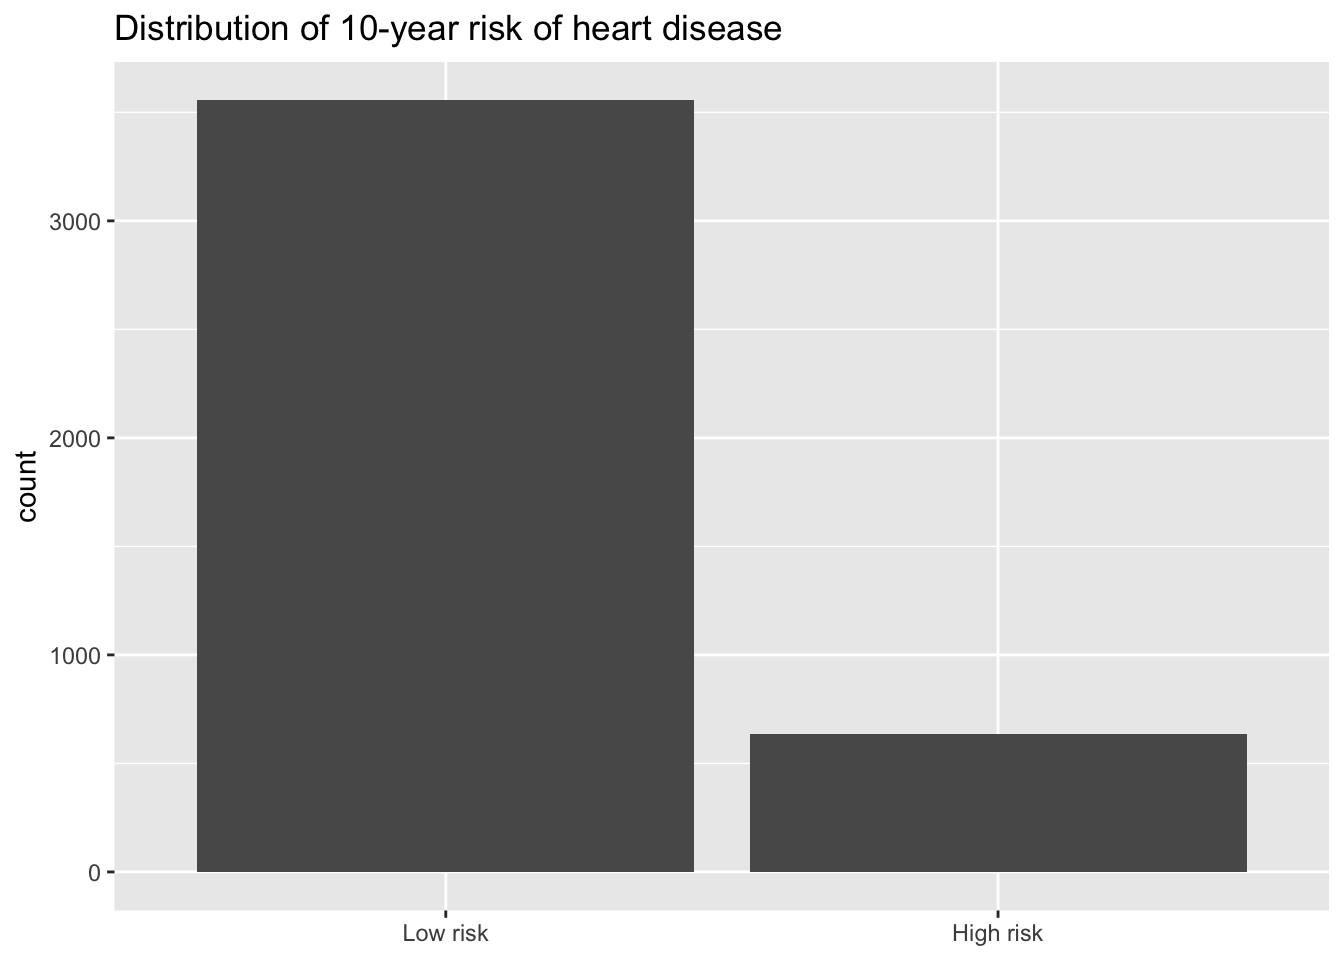
heart_disease %>%
  count(high_risk)
# A tibble: 2 × 2
high_risk n
<fct> <int>
1 0 3555
2 1 635Calculating probability and odds
What is the probability a randomly selected person in the study is not high risk for heart disease?
What are the odds a randomly selected person in the study is not high risk for heart disease?
Logistic regression model
Fit a logistic regression model to understand the relationship between total cholesterol and risk for heart disease.
Let \(pi\) be the probability an adult is high risk. The statistical model is
\[\log\Big(\frac{\pi_i}{1-\pi_i}\Big) = \beta_0 + \beta_1 TotChol_i\]
heart_disease_fit <- logistic_reg() %>%
  set_engine("glm") %>%
  fit(high_risk ~ totChol, data = heart_disease, family = "binomial")

tidy(heart_disease_fit) %>% kable(digits = 3)| term | estimate | std.error | statistic | p.value |
|---|---|---|---|---|
| (Intercept) | -2.894 | 0.230 | -12.607 | 0 |
| totChol | 0.005 | 0.001 | 5.268 | 0 |
- Write the regression equation. Round to 3 digits.
Calculating log-odds, odds and probabilities
Based on the model, if a randomly selected person has a total cholesterol of 250 mg/dL,
What are the log-odds they are high risk for heart disease?
What are the odds they are high risk for heart disease?
What is the probability they are high risk for heart disease? Use the odds to calculate your answer.
Comparing observations
Suppose a person’s cholesterol changes from 250 mg/dL to 200 mg/dL.
How do you expect the log-odds that this person is high risk for heart disease to change?
How do you expect the odds that this person is high risk for heart disease to change?