library(tidyverse)
library(tidymodels)
library(knitr)
library(patchwork)HW 4 - Multinomial logistic regression
Due Friday, April 8, 5pm on Gradescope
Introduction
In this assignment, you’ll get to put into practice the logistic regression skills you’ve developed.
Learning goals
In this assignment, you will…
- Fit and interpret multinomial logistic regression models.
- Evaluate model conditions
- Continue developing a workflow for reproducible data analysis.
Getting started
Your repo for this assignment is at github.com/sta210-s22 and starts with the prefix hw-4. For more detailed instructions on getting started, see HW 1.
Packages
The following packages will be used in this assignment. You can add other packages as needed.
Data
For this assignment, we will analyze data from the eye witness identification experiment in Carlson and Carlson (2014). In this experiment, participants were asked to watch a video of a mock crime (from the first person perspective), spend a few minutes completing a random task, and then identify the perpetrator of the mock crime from a line up shown on the screen. Every lineup in this analysis included the true perpetrator from the video. After viewing the line-up , each participant could make one of the following decisions (id):
- correct: correctly identified the true perpetrator
- foil: incorrectly identified the “foil”, i.e. a person who looks very similar to the perpetrator
- reject: incorrectly concluded the true perpetrator is not in the lineup
The main objective of the analysis is to understand how different conditions of the mock crime and suspect lineup affect the decision made by the participant. We will consider the following conditions to describe the decisions:
lineup: How potential suspects are shown to the participants- Simultaneous Lineup: Participants were shown photos of all 6 potential suspects at the same time and were required to make a single decision (identify someone from the lineup or reject the lineup).
- Sequential 5 Lineup: Photos of the 6 suspects were shown one at a time. The participant was required to make a decision (choose or don’t choose) as each photo was shown. Once a decision was made, participants were not allowed to reexamine a photo. If the participant made an identification, the remaining photos were not shown. In each of these lineups the true perpetrator was always the 5th photo in the lineup.
weapon: Whether or not a weapon was present in the video of the mock crime.feature: Whether or not the perpetrator had a distinctive marking on his face. In this experiment, the distinctive feature was a large “N” sticker on one cheek. (The letter “N” was chosen to represent the first author’s alma mater - University of Nebraska.)
The data may be found in eyewitness.csv in the data folder.
ew <- read_csv(here::here("hw", "data/eyewitness.csv"))
ew <- ew %>%
  mutate(id = as_factor(id))
Exercises
- Let’s begin by doing some exploratory data analysis. The univariate (single variable) plots for each of the predictor variables and the response variable are shown below.
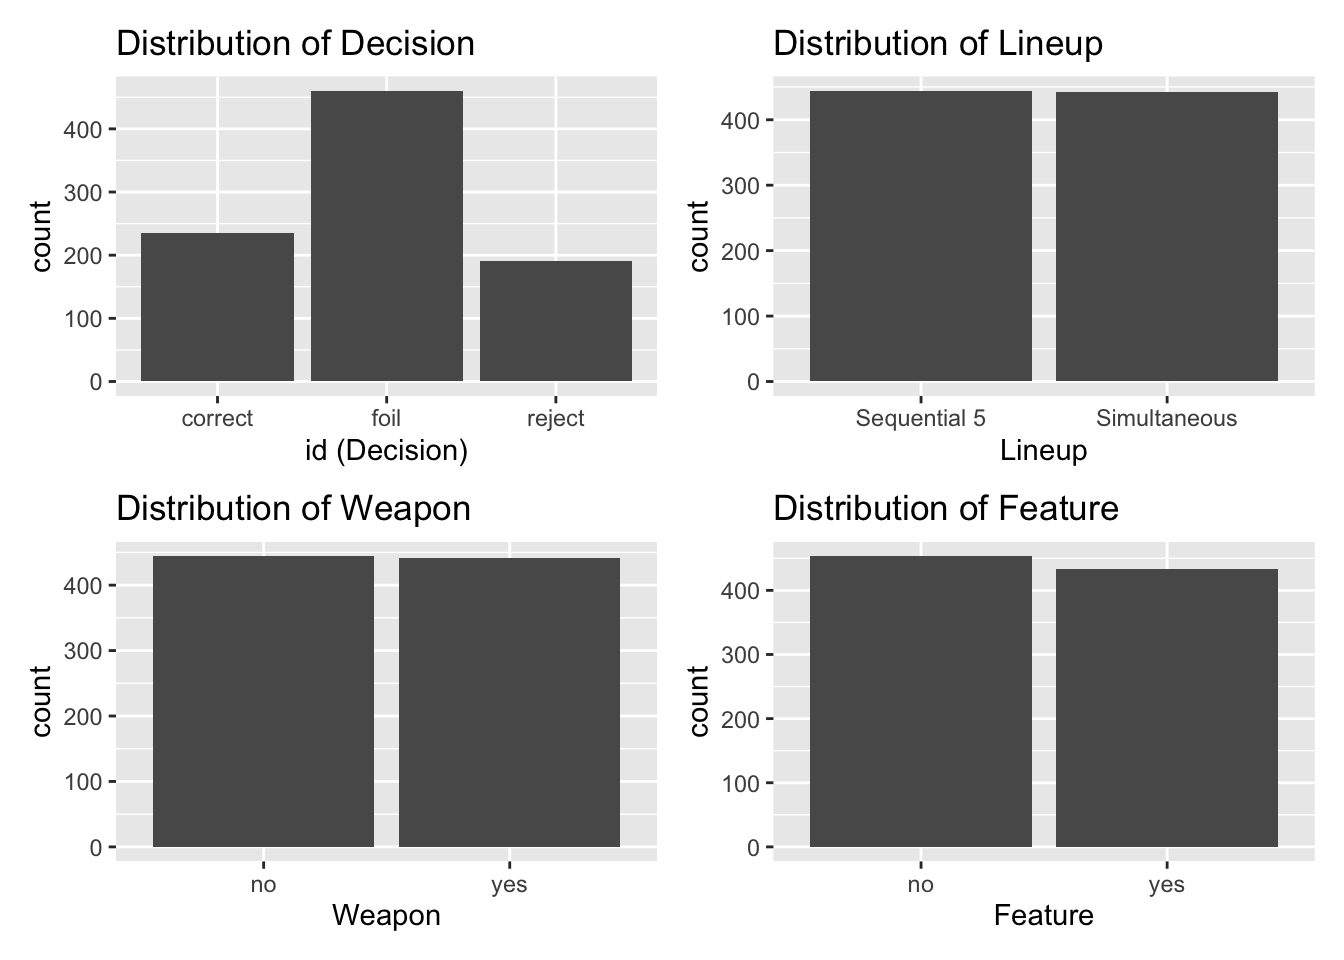
Complete the exploratory data analysis by creating the plots and/or summary statistics to examine the relationship between the response variable (id) and each of the explanatory variables (lineup, weapon, and feature).
- Using the plots/tables from Exercise 1:
- What is one thing you learn about the data from the univariate plots?
- Based on the bivariate plots, do any of the predictors appear to have a significant effect on the
id? Briefly explain.
Briefly explain why you should use a multinomial logistic regression model to predict
idusinglineup,weaponandfeature.Fit the multinomial logistic model that only includes main effects. Display the model output.
- What is the baseline category for the response variable?
- Interpret the intercepts for each part of the model in terms of the odds.
- Interpret the coefficients of
lineupfor each part of the model in terms of the odds.
- You want to consider all possible first-order interaction effects (interaction effects between two variables) for the model.
- Use the appropriate test to determine if there is at least one significant interaction effect.
- Based on your test, is there evidence of any significant interaction effects?
Regardless of your answer to Question 5, use the model that includes the interaction terms for the remainder of the assignment.
- According to the model,
- If there was no weapon but the perpetrator had a distinctive feature in the mock crime, how do the log-odds of reject vs. a correct ID change when there is a simultaneous lineup vs. a sequential lineup?
- If there was no weapon but the perpetrator had a distinctive feature in the mock crime, how do the odds of reject vs. a correct ID change when there is a simultaneous lineup vs. a sequential lineup?
- Which group of participants (i.e., which set of experimental conditions) is described by the intercept?
Are the conditions inference met? List of the conditions, and, if relevant, create visualizations to check the conditions and evaluate whether each condition is met. Include an assessment about each condition and a brief explanation about your conclusion.
Use the model to predict the decision made by each participant. Make a table of the predicted vs. the actual decisions.
- Briefly describe how the predicted decision is determined for each participant.
- What is the misclassification rate?
Submission
Warning
Before you wrap up the assignment, make sure all documents are updated on your GitHub repo. We will be checking these to make sure you have been practicing how to commit and push changes.
Remember – you must turn in a PDF file to the Gradescope page before the submission deadline for full credit.
To submit your assignment:
- Go to http://www.gradescope.com and click Log in in the top right corner.
- Click School Credentials ➡️ Duke NetID and log in using your NetID credentials.
- Click on your STA 210 course.
- Click on the assignment, and you’ll be prompted to submit it.
- Mark the pages associated with each exercise. All of the pages of your lab should be associated with at least one question (i.e., should be “checked”).
- Select the first page of your PDF submission to be associated with the “Workflow & formatting” section.
Grading
Total points available: 50 points.
| Component | Points |
|---|---|
| Exercises | 45 |
| Workflow & formatting | 51 |
Footnotes
The “Workflow & formatting” grade is to assess the reproducible workflow. This includes having at least 3 informative commit messages and updating the name and date in the YAML.↩︎