Lab 3 - Coffee ratings

STA 210 - Spring 2022
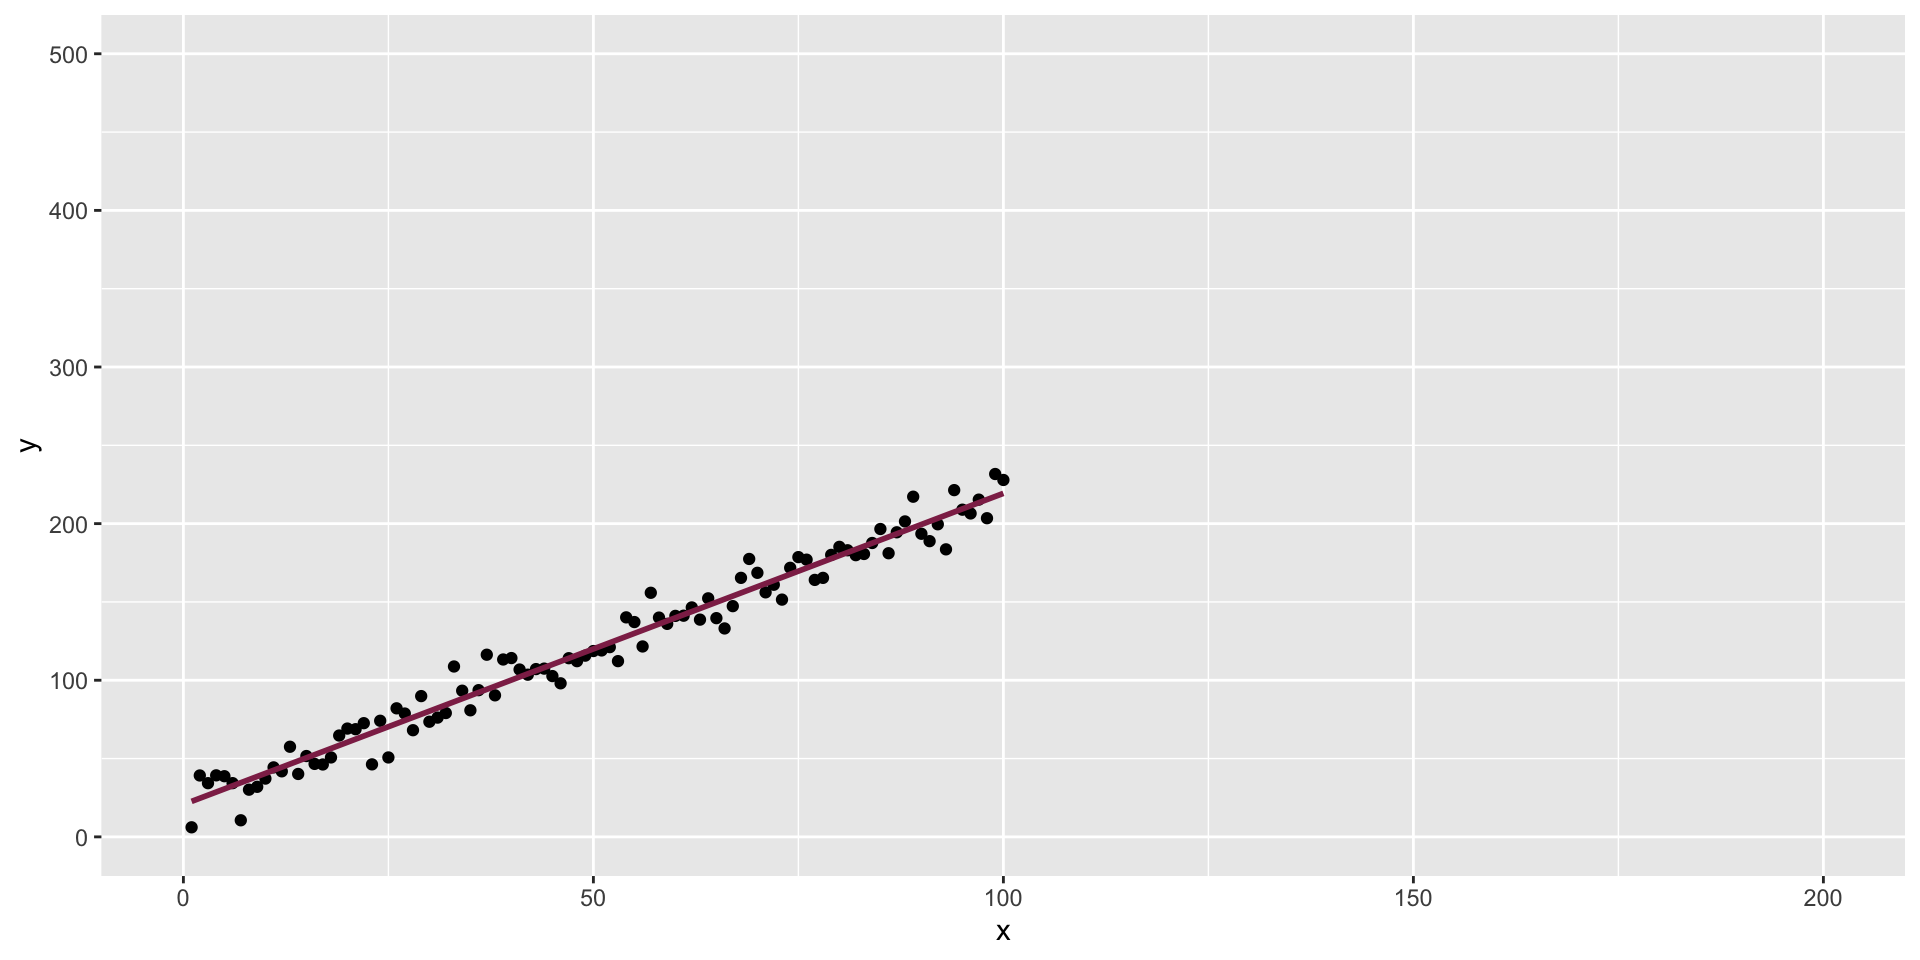
Welcome

Goals

  • Meet your team!
  • Ice breaker / get to know your team
  • Team agreement
  • Lab 3 - Coffee ratings

Meet your team!

  • Click here to find your team.

  • Sit with your team.

Icebreaker

  • Quick introductions: Name and hometown

  • Choose a reporter: The person whose birthday is closest to January 31

  • Identify 8 things everyone in the group has in common:

    • Not clothes, e.g., we’re all wearing shoes!
    • Not body parts, e.g., we all have a nose!
05:00

Team name + agreement

  • Come up with a team name. You can’t have the same name as another group in the class, so be creative!

    • Your TA will get your team name by the end of lab.
  • Fill out the team agreement. The goals of the agreement are to…

    • Gain a common understanding of the team’s goals and expectations for collaboration
    • Make a plan for team communication
    • Make a plan for working outside of lab

Team workflow

  • Only one team member should type at a time. There are markers in today’s lab to help you determine whose turn it is to type.

    • Every team member should still be engaged in discussion for all questions, even if it’s not your turn type.
  • Don’t forget to pull to get your teammates’ updates before making changes to the .qmd file.

  • Only one submission for the team on Gradescope.

Team workflow, in action

  • Complete the “Workflow: Using Git and GitHub as a team” section of the lab in your teams.
  • When done, pause and wait for your TA to walk you through the rest of the slides before continuing to the following section.
10:00

Tips for working in a team

  • Do not pressure each other to finish early; use the time wisely to really learn the material and produce a quality report.
  • The labs are structured to help you learn the steps of a data analysis. Do not split up the lab among the team members; work on it together in its entirety.
  • Everyone has something to contribute! Use the lab groups as an opportunity to share ideas and learn from each other.

Model diagnostics

The data

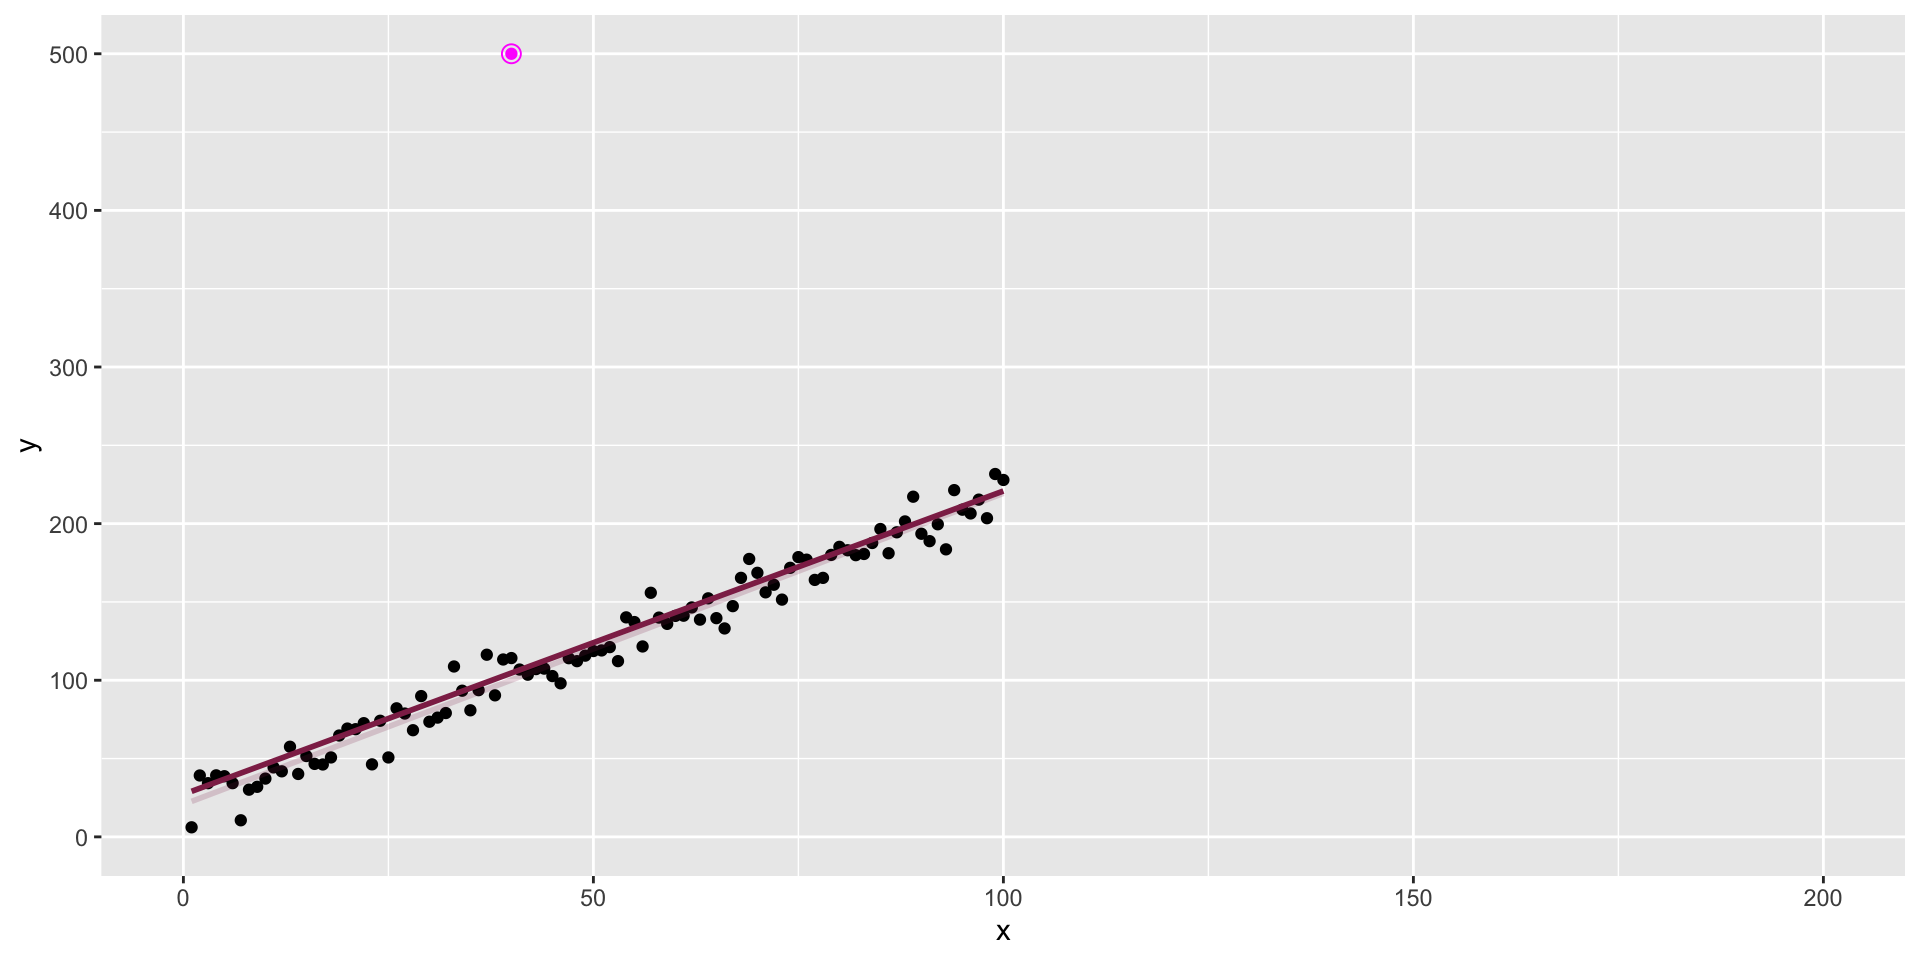
The data + an outlier

The data + influential point
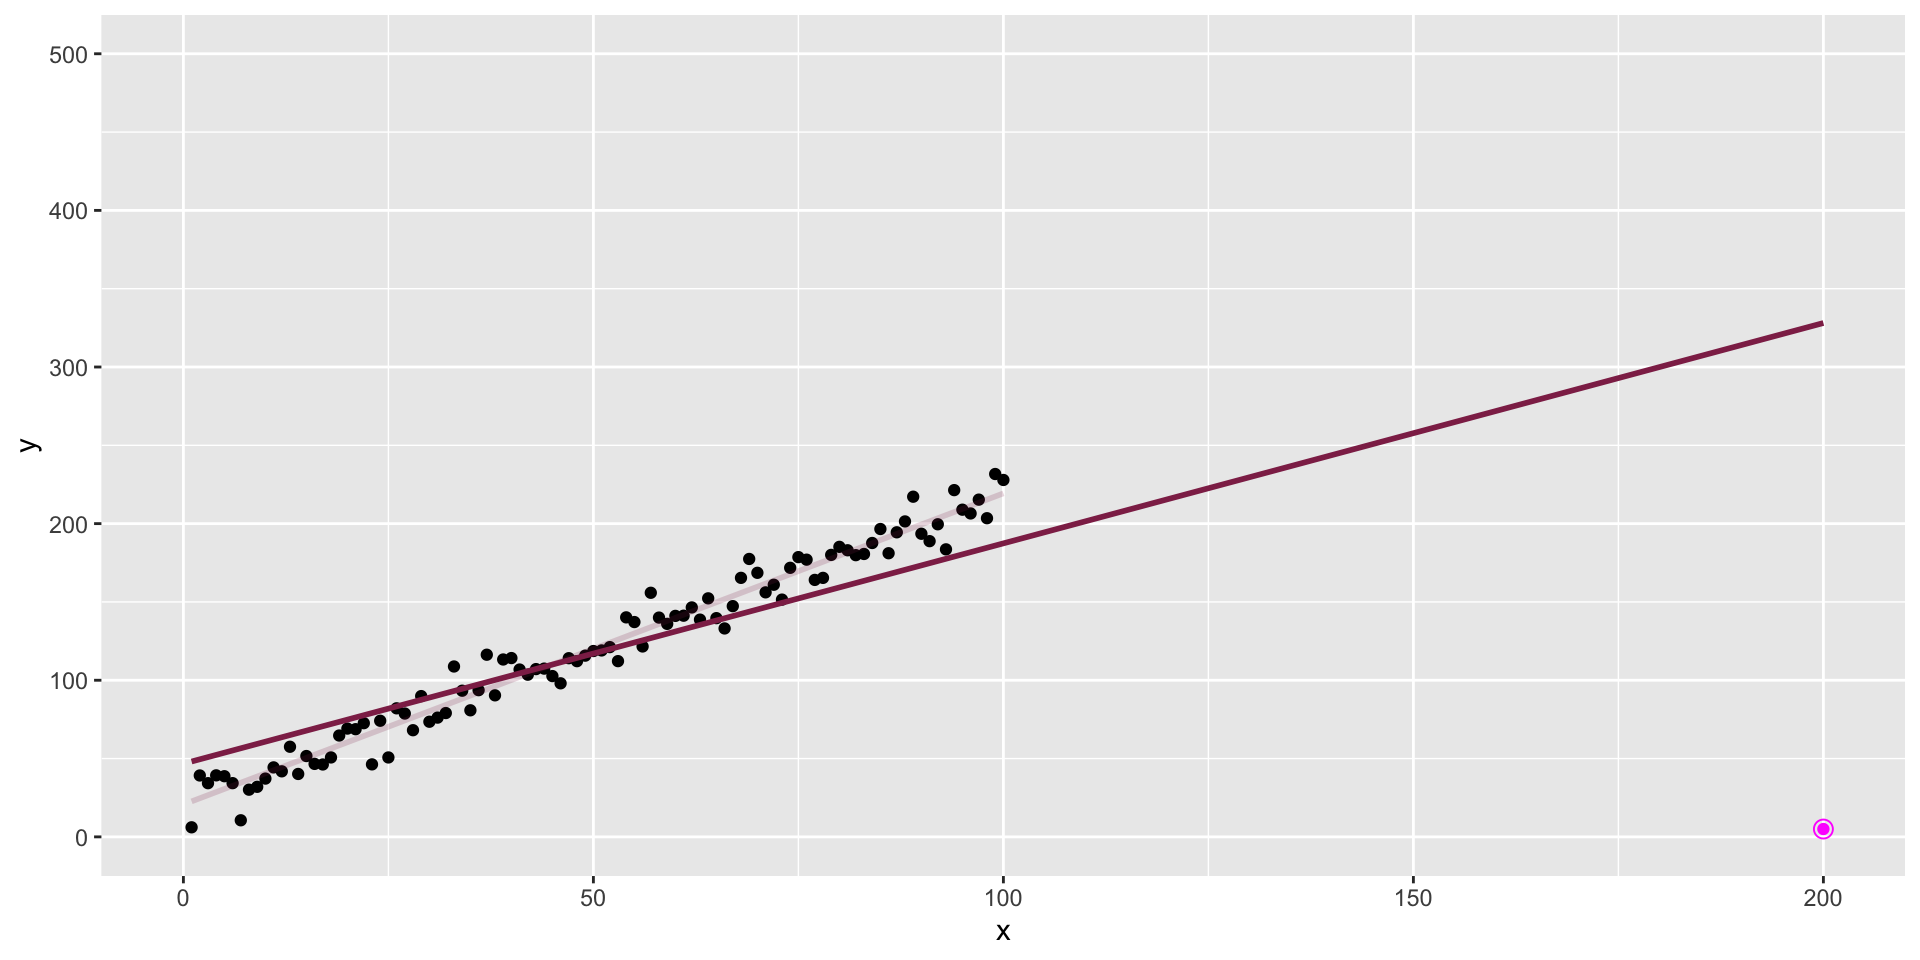
Influential point

An observation is influential if removing it substantially changes the coefficients of the regression model.

Influential points

  • Influential points have a large impact on the coefficients and standard errors used for inference

  • These points can sometimes be identified in a scatterplot if there is only one predictor variable, this is often not the case when there are multiple predictors

  • We will use measures to quantify an individual observation’s influence on the regression model: leverage, standardized residuals, and Cook’s distance

Remember augment()?

mtcars_fit <- linear_reg() %>%
  set_engine("lm") %>%
  fit(mpg ~ disp, data = mtcars)

augment(mtcars_fit$fit)
# A tibble: 32 × 9
   .rownames           mpg  disp .fitted .resid   .hat .sigma .cooksd .std.resid
   <chr>             <dbl> <dbl>   <dbl>  <dbl>  <dbl>  <dbl>   <dbl>      <dbl>
 1 Mazda RX4          21    160     23.0 -2.01  0.0418   3.29 8.65e-3     -0.630
 2 Mazda RX4 Wag      21    160     23.0 -2.01  0.0418   3.29 8.65e-3     -0.630
 3 Datsun 710         22.8  108     25.1 -2.35  0.0629   3.28 1.87e-2     -0.746
 4 Hornet 4 Drive     21.4  258     19.0  2.43  0.0328   3.27 9.83e-3      0.761
 5 Hornet Sportabout  18.7  360     14.8  3.94  0.0663   3.22 5.58e-2      1.25 
 6 Valiant            18.1  225     20.3 -2.23  0.0313   3.28 7.82e-3     -0.696
 7 Duster 360         14.3  360     14.8 -0.462 0.0663   3.31 7.70e-4     -0.147
 8 Merc 240D          24.4  147.    23.6  0.846 0.0461   3.30 1.72e-3      0.267
 9 Merc 230           22.8  141.    23.8 -0.997 0.0482   3.30 2.50e-3     -0.314
10 Merc 280           19.2  168.    22.7 -3.49  0.0396   3.24 2.48e-2     -1.10 
# … with 22 more rows

Model diagnostics

Use the augment() function to output statistics that can be used to diagnose the model, along with the predicted values and residuals:

  • outcome and predictor variables in the model
  • .fitted: predicted values
  • .se.fit: standard errors of predicted values
  • .resid: residuals
  • .hat: leverage
  • .sigma: estimate of residual standard deviation when the corresponding observation is dropped from model
  • .cooksd: Cook’s distance
  • .std.resid: standardized residuals